
Python for Algo Trading (ATA Certification)
About Course
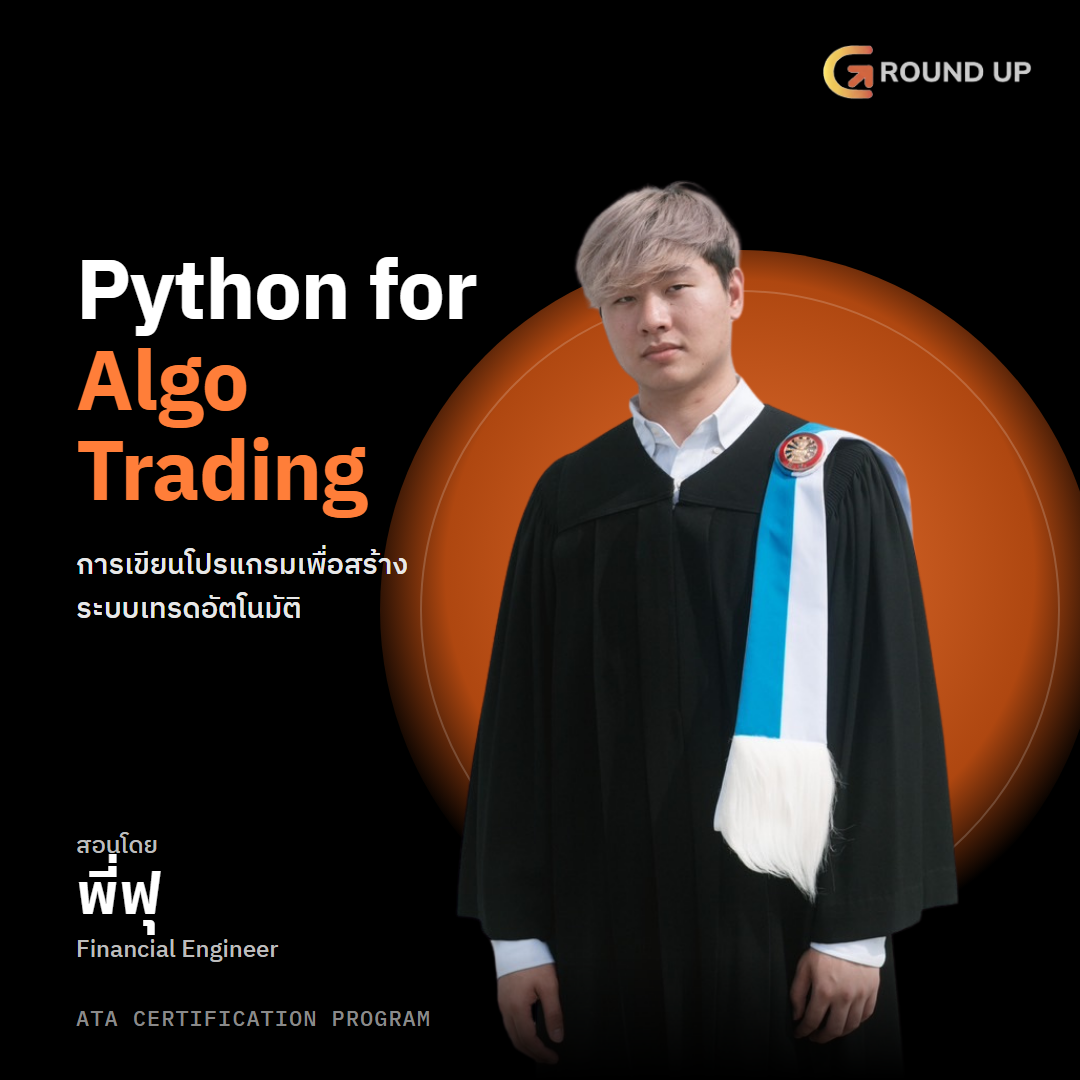
Python for Algo Trading
การเขียนโปรแกรมเพื่อสร้างระบบเทรดอัตโนมัติ
วิชานี้อยู่ในหลักสูตร Algorithmic Trading in Action (ATA) Certification Program — Quant Series
ของ GroundUp Academy เรียนแบบ Video on Demand ดูย้อนหลังได้ตลอด
สอนโดย พี่ฟุ Financial Engineer
เรียนตั้งแต่พื้นฐาน Python ไปจนถึงการดึงข้อมูลตลาด คำนวณ returns และ metric
และทำกราฟสำหรับวิเคราะห์ข้อมูลการเงิน โดยใช้ตัวอย่างและตรรกะแบบที่ใช้ในระบบเทรดจริง
Module 1: Python Fundamentals for Trading
1.1 Variables, Data Types & Operations
ตัวแปร ชนิดข้อมูลตัวเลขและข้อความ การแปลงชนิดข้อมูล ตัวดำเนินการทางคณิตศาสตร์และการเปรียบเทียบเชิงตรรกะสำหรับเงื่อนไขการเทรด
1.2 Data Structures & Flow Control
list, tuple และ dictionary สำหรับเก็บรายชื่อสินทรัพย์และพารามิเตอร์ การแตกเงื่อนไขด้วย if-else และการวนซ้ำด้วย for/while
1.3 Functions & List Comprehensions
เขียนฟังก์ชันที่ใช้ซ้ำได้สำหรับการคำนวณทางการเงิน list comprehension และแนวปฏิบัติเรื่อง scope
Module 2: Pandas Fundamentals for Financial Data
2.1 DataFrames & Series Structures
สร้าง DataFrame และ Series ตรวจสอบคุณสมบัติของข้อมูล และเพิ่มคอลัมน์หรือ metric ที่คำนวณเอง
2.2 Data Indexing, Selection & Filtering
เลือกข้อมูลด้วย .loc และ .iloc และ boolean indexing เพื่อแยกช่วงสภาวะตลาดที่สนใจ
2.3 Aligning, Resampling & Concatenation
รวมข้อมูลด้วย pd.concat() แปลงข้อมูลรายนาทีหรือรายวันเป็นกรอบเวลาที่ใหญ่ขึ้น และสร้างแท่ง OHLC จากการ aggregate
Module 3: Applied Financial Data Analysis
3.1 Fetching & Cleaning Market Data
ดึงข้อมูล OHLC ของหุ้นและ crypto ผ่าน yfinance จัดการวันที่ไม่มีการซื้อขาย และจัดแนวข้อมูลตามปฏิทินทำการ
3.2 Calculating Returns & Rolling Metrics
คำนวณ simple return และ log return ด้วย .pct_change() ค่าเฉลี่ยเคลื่อนที่ และ rolling volatility ด้วย .rolling()
3.3 Vectorization & Performance Metrics
เปรียบเทียบการวนทีละแถวกับ vectorized operations และคำนวณ drawdown เบื้องต้นของกลยุทธ์
Module 4: Financial Data Visualization
4.1 Static Plotting with Matplotlib
กราฟเส้นราคา แกนรองสำหรับ volume legend annotation และ overlay จุดเข้า-ออกของสัญญาณซื้อขาย
4.2 Statistical & Risk Plots with Seaborn
การกระจายของ returns, KDE plot, correlation heatmap ระหว่างสินทรัพย์ และ pairplot สำหรับวิเคราะห์หลายสินทรัพย์
4.3 Interactive Financial Charts with Plotly
กราฟแท่งเทียนแบบ interactive ด้วย plotly.graph_objects วางตัวชี้วัด SMA/RSI ซ้อนบนกราฟ และตั้งค่า hover tooltip
ใบรับรอง
ผู้เรียนที่เรียนครบทุกวิชาในหลักสูตรและส่งโปรเจกต์ backtest ระบบเทรด 1 ระบบ
จะได้รับใบรับรองจาก GroundUp Academy
Course Content
Course Syllabus
-
0.Introduction
07:52 -
1. Python Fundamentals for Trading
36:06 -
2. Pandas Fundamentals for Financial Data
25:34 -
3. Applied Financial Data Analysis
24:48 -
4. Financial Data Visualization
15:52